> ## Documentation Index
> Fetch the complete documentation index at: https://tigerdata-747200db-chore-custom-colored-homepage.mintlify.site/llms.txt
> Use this file to discover all available pages before exploring further.
# Integrate Datadog with Tiger Cloud
> Datadog is a cloud-based monitoring and analytics platform. Export telemetry data from your Tiger Cloud service with time-series and analytics capability to Datadog
export const SERVICE_SHORT = 'service';
export const CLOUD_LONG = 'Tiger Cloud';
export const CONSOLE = 'Tiger Cloud Console';
export const SERVICE_LONG = 'Tiger Cloud service';
[Datadog][datadog] is a cloud-based monitoring and analytics platform that provides comprehensive visibility into
applications, infrastructure, and systems through real-time monitoring, logging, and analytics.
This page explains how to:
* [Monitor {SERVICE_LONG} metrics with Datadog][datadog-monitor-cloud]
This integration is available for [Scale and Enterprise][pricing-plan-features] pricing plans.
* Configure Datadog Agent to collect metrics for your {SERVICE_LONG}
This integration is available for all pricing plans.
## Prerequisites
To follow the steps on this page:
* Create a target [{SERVICE_LONG}][create-service] with time-series and analytics enabled.
You need your [connection details][connection-info].
[create-service]: /cloud/get-started/create-services
[connection-info]: /integrations/find-connection-details/
* Sign up for [Datadog][datadog-signup].
You need your [Datadog API key][datadog-api-key] to follow this procedure.
* Install [Datadog Agent][datadog-agent-install].
## Monitor {SERVICE_LONG} metrics with Datadog
Export telemetry data from your {SERVICE_LONG}s with the time-series and analytics capability enabled to
Datadog using a {CLOUD_LONG} data exporter. The available metrics include CPU usage, RAM usage, and storage.
### Create a data exporter
A {CLOUD_LONG} data exporter sends telemetry data from a {SERVICE_LONG} to a third-party monitoring
tool. You create an exporter on the [project level][projects], in the same AWS region as your {SERVICE_SHORT}:
1. **In {CONSOLE}, open [Exporters][console-integrations]**
2. **Click `New exporter`**
3. **Select `Metrics` for `Data type` and `Datadog` for provider**
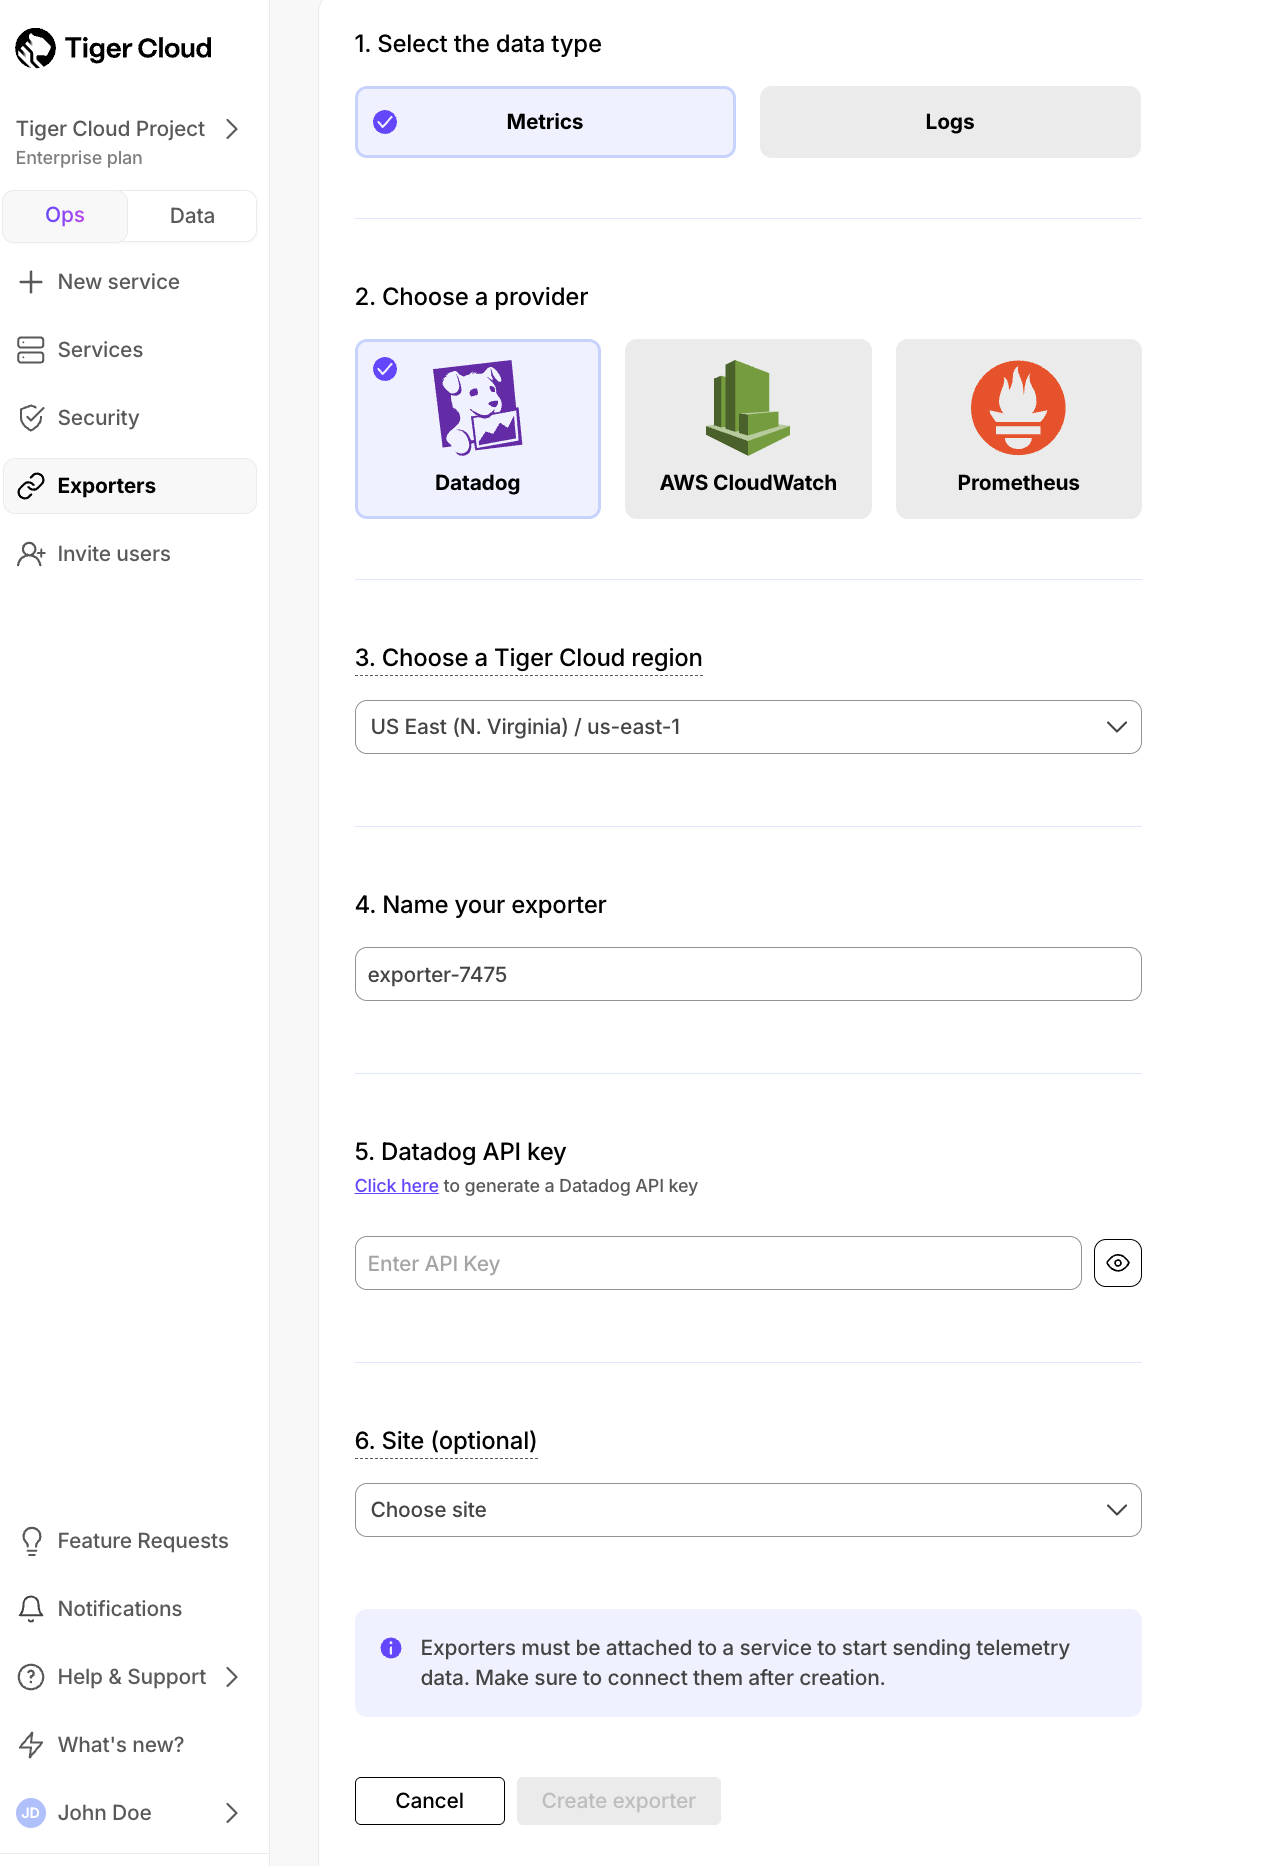
4. **Choose your AWS region and provide the API key**
The AWS region must be the same for your {CLOUD_LONG} exporter and the Datadog provider.
5. **Set `Site` to your Datadog region, then click `Create exporter`**
[console-integrations]: https://console.cloud.timescale.com/dashboard/integrations
### Manage a data exporter
This section shows you how to attach, monitor, edit, and delete a data exporter.
### Attach a data exporter to a {SERVICE_LONG}
To send telemetry data to an external monitoring tool, you attach a data exporter to your
{SERVICE_LONG}. You can attach only one exporter to a {SERVICE_SHORT}.
To attach an exporter:
1. **In [{CONSOLE}][console-services], choose the {SERVICE_SHORT}**
2. **Click `Operations` > `Exporters`**
3. **Select the exporter, then click `Attach exporter`**
4. **If you are attaching a first `Logs` data type exporter, restart the {SERVICE_SHORT}**
### Monitor {SERVICE_LONG} metrics
You can now monitor your {SERVICE_SHORT} metrics. Use the following metrics to check the service is running correctly:
* `timescale.cloud.system.cpu.usage.millicores`
* `timescale.cloud.system.cpu.total.millicores`
* `timescale.cloud.system.memory.usage.bytes`
* `timescale.cloud.system.memory.total.bytes`
* `timescale.cloud.system.disk.usage.bytes`
* `timescale.cloud.system.disk.total.bytes`
Additionally, use the following tags to filter your results.
| Tag | Example variable | Description |
| ------------ | --------------------------- | --------------------------------- |
| `host` | `us-east-1.timescale.cloud` | |
| `project-id` | | |
| `service-id` | | |
| `region` | `us-east-1` | AWS region |
| `role` | `replica` or `primary` | For {SERVICE_SHORT} with replicas |
| `node-id` | | For multi-node services |
### Edit a data exporter
To update a data exporter:
1. **In {CONSOLE}, open [Exporters][console-integrations]**
2. **Next to the exporter you want to edit, click the menu > `Edit`**
3. **Edit the exporter fields and save your changes**
You cannot change fields such as the provider or the AWS region.
### Delete a data exporter
To remove a data exporter that you no longer need:
1. **Disconnect the data exporter from your {SERVICE_LONG}s**
1. In [{CONSOLE}][console-services], choose the {SERVICE_SHORT}.
2. Click `Operations` > `Exporters`.
3. Click the trash can icon.
4. Repeat for every {SERVICE_SHORT} attached to the exporter you want to remove.
The data exporter is now unattached from all {SERVICE_SHORT}s. However, it still exists in your project.
2. **Delete the exporter on the project level**
1. In {CONSOLE}, open [Exporters][console-integrations]
2. Next to the exporter you want to edit, click menu > `Delete`
3. Confirm that you want to delete the data exporter.
### Reference
When you create the IAM OIDC provider, the URL must match the region you create the exporter in.
It must be one of the following:
| Region | Zone | Location | URL |
| ---------------- | ------------- | -------------- | ------------------------------------------------------------------------- |
| `ap-southeast-1` | Asia Pacific | Singapore | `irsa-oidc-discovery-prod-ap-southeast-1.s3.ap-southeast-1.amazonaws.com` |
| `ap-southeast-2` | Asia Pacific | Sydney | `irsa-oidc-discovery-prod-ap-southeast-2.s3.ap-southeast-2.amazonaws.com` |
| `ap-northeast-1` | Asia Pacific | Tokyo | `irsa-oidc-discovery-prod-ap-northeast-1.s3.ap-northeast-1.amazonaws.com` |
| `ca-central-1` | Canada | Central | `irsa-oidc-discovery-prod-ca-central-1.s3.ca-central-1.amazonaws.com` |
| `eu-central-1` | Europe | Frankfurt | `irsa-oidc-discovery-prod-eu-central-1.s3.eu-central-1.amazonaws.com` |
| `eu-west-1` | Europe | Ireland | `irsa-oidc-discovery-prod-eu-west-1.s3.eu-west-1.amazonaws.com` |
| `eu-west-2` | Europe | London | `irsa-oidc-discovery-prod-eu-west-2.s3.eu-west-2.amazonaws.com` |
| `sa-east-1` | South America | São Paulo | `irsa-oidc-discovery-prod-sa-east-1.s3.sa-east-1.amazonaws.com` |
| `us-east-1` | United States | North Virginia | `irsa-oidc-discovery-prod.s3.us-east-1.amazonaws.com` |
| `us-east-2` | United States | Ohio | `irsa-oidc-discovery-prod-us-east-2.s3.us-east-2.amazonaws.com` |
| `us-west-2` | United States | Oregon | `irsa-oidc-discovery-prod-us-west-2.s3.us-west-2.amazonaws.com` |
[aws-access-keys]: https://docs.aws.amazon.com/IAM/latest/UserGuide/id_users_create.html#id_users_create_console
[irsa]: https://aws.amazon.com/blogs/opensource/introducing-fine-grained-iam-roles-service-accounts/
[cross-account-iam-roles]: https://aws.amazon.com/blogs/containers/cross-account-iam-roles-for-kubernetes-service-accounts/
[cloudwatch]: https://aws.amazon.com/cloudwatch/
[cloudwatch-docs]: https://docs.aws.amazon.com/cloudwatch/index.html
[cloudwatch-log-naming]: https://docs.aws.amazon.com/AmazonCloudWatch/latest/logs/Working-with-log-groups-and-streams.html
[datadog]: https://www.datadoghq.com
[datadog-api-key]: https://docs.datadoghq.com/account_management/api-app-keys/#add-an-api-key-or-client-token
[datadog-docs]: https://docs.datadoghq.com/
[datadog-metrics-explorer]: https://app.datadoghq.com/metric/explorer
[console-integrations]: https://console.cloud.timescale.com/dashboard/integrations
[console-services]: https://console.cloud.timescale.com/dashboard/services
[list-iam-users]: https://console.aws.amazon.com/iam/home#/users
[create-an-iam-user]: https://console.aws.amazon.com/iam/home#/users/create
[console-cloudwatch-configuration]: https://console.aws.amazon.com/cloudwatch/home#logsV2:log-groups
[console-cloudwatch-create-group]: https://console.aws.amazon.com/cloudwatch/home#logsV2:log-groups/create-log-group
[services-portal]: https://console.cloud.timescale.com/dashboard/services
[pricing-plan-features]: /about/:currentVersion:/pricing-and-account-management/#features-included-in-each-plan
## Configure Datadog Agent to collect metrics for your {SERVICE_LONG}s
Datadog Agent includes a [{PG} integration][datadog-postgres] that you use to collect detailed {PG} database
metrics about your {SERVICE_LONG}s.
1. **Connect to your {SERVICE_LONG}**
For {CLOUD_LONG}, open an [SQL editor][run-queries] in [{CONSOLE}][open-console]. For {SELF_LONG}, use [`psql`][psql].
2. **Add the `datadog` user to your {SERVICE_LONG}**
```sql
create user datadog with password '';
```
```sql
grant pg_monitor to datadog;
```
```sql
grant SELECT ON pg_stat_database to datadog;
```
3. **Test the connection and rights for the datadog user**
Update the following command with your [connection details][connection-info], then run it from the command line:
```bash
psql "postgres://datadog:@:/tsdb?sslmode=require" -c \
"select * from pg_stat_database LIMIT(1);" \
&& echo -e "\e[0;32mPostgres connection - OK\e[0m" || echo -e "\e[0;31mCannot connect to Postgres\e[0m"
```
You see the output from the `pg_stat_database` table, which means you have given the correct rights to `datadog`.
4. **Connect Datadog to your {SERVICE_LONG}**
1. Open the datadog agent {PG} configuration file, usually located at:
* **Linux**: `/etc/datadog-agent/conf.d/postgres.d/conf.yaml`
* **MacOS**: `/opt/datadog-agent/etc/conf.d/postgres.d/conf.yaml`
* **Windows**: `C:\ProgramData\Datadog\conf.d\postgres.d\conf.yaml`
2. Integrate Datadog Agent with your {SERVICE_LONG}
Use your [connection details][connection-info] to update the following and add it to the datadog agent {PG}
configuration file:
```yaml
init_config:
instances:
- host:
port:
username: datadog
password: >
dbname: tsdb
disable_generic_tags: true
```
5. **Add {CLOUD_LONG} metrics**
Tags to make it easier for build Datadog dashboards that combine metrics from the {CLOUD_LONG} data exporter and
Datadog Agent. Use your [connection details][connection-info] to update the following and add it to
`/datadog.yaml`:
```yaml
tags:
- project-id:
- service-id:
- region:
```
6. **Restart Datadog Agent**
See how to [Start, stop, and restart Datadog Agent][datadog-agent-restart].
Metrics for your {SERVICE_LONG} are now visible in Datadog. Check the Datadog {PG} integration documentation for a
comprehensive list of [metrics][datadog-postgres-metrics] collected.
[datadog]: https://www.datadoghq.com/
[datadog-agent-install]: https://docs.datadoghq.com/getting_started/agent/#installation
[datadog-postgres]: https://docs.datadoghq.com/integrations/postgres/
[datadog-postgres-metrics]: https://docs.datadoghq.com/integrations/postgres/?tab=host#metrics
[datadog-postgres-setup]: https://docs.datadoghq.com/integrations/postgres/?tab=host#configuration
[datadog-signup]: https://www.datadoghq.com/
[datadog-monitor-cloud]: /integrations/:currentVersion:/datadog/#monitor-timescale-cloud-service-metrics-with-datadog
[datadog-agent]: /integrations/:currentVersion:/datadog/#configure-datadog-agent-to-collect-metrics-for-your-timescale-cloud-services
[datadog-agent-restart]: https://docs.datadoghq.com/agent/configuration/agent-commands/#start-stop-and-restart-the-agent
[projects]: /use-timescale/:currentVersion:/members/
[datadog-api-key]: https://docs.datadoghq.com/account_management/api-app-keys/#add-an-api-key-or-client-token
[pricing-plan-features]: /about/:currentVersion:/pricing-and-account-management/#features-included-in-each-plan
[run-queries]: /getting-started/:currentVersion:/run-queries-from-console/
[open-console]: https://console.cloud.timescale.com/dashboard/services
[psql]: /integrations/:currentVersion:/psql/
[connection-info]: /integrations/:currentVersion:/find-connection-details/